
 Facebook
 X
X
 Pinterest
 Copy Link
Chugging Along


The real estate market keeps chugging along.
Here’s news from the Mortgage Banker’s Association…
Last week, applications to purchase a home hit their highest level since April 2010. This is clearly a sign that the spring selling season is starting off in full swing.
You may remember that the reason why April 2010 was so active is because of the Home Buyer Tax Credit that was in effect. In order to get a special income tax incentive, buyers had to go under contract in April 2010 and close by June 30, 2010.
Today, purchase applications are at their highest level in 9 years and are up 14% over last year. Interest rates are roughly 0.5% lower than 6 months ago and roughly 3.0% below their long-term average.
Let the Spring Selling Season begin!
Which Market?

So, which is it? A buyer’s market or a seller’s market?

Well, it depends!
First, let’s define each market. According to research, a buyer’s market exists when there is more than 4-6 months of inventory on the market.
If it would take longer than 4-6 months to sell out all of the inventory currently for sale, then it is a buyer’s market.
This calculation is obviously a function of the amount of inventory on the market and the current pace of sales.
A seller’s market exists if it would take shorter than 4-6 months.
So, which is it?
It depends very much on the price range.
Here are the numbers for Northern Colorado:
• $300,000 to $400,000 = 0.9 months
• $400,000 to $500,000 = 1.9 months
• $500,000 to $750,000 = 2.3 months
• $750,000 and over = 5.8 months
So, most price ranges are a clear seller’s market. It’s not until $750,000 and over that the market starts to approach a more balanced state.
Here’s one more thing that might help you…
You probably don’t need a reminder that this is tax season.
Not only because tax returns are due in two weeks but also because you will soon receive your property tax notification in the mail.
Every two years your County re-assesses the value of your property and then sends that new value to you.
When this happens, many of our clients:
- Don’t agree with the new assessed value
- Aren’t sure what to do
- Are confused by the process
- Want to save money on property taxes
Good news! We have a webinar that will help you. On the webinar we will show you:
- How to read the information from the County
- What it means for you
- How to protest the valuation if you want
- How to get an accurate estimate of your property’s value
You can listen to the webinar live or get the recording. In any case, you can sign up at www.WindermereWorkshop.com
The webinar is April 17th at 10:00. If you can’t join live, go ahead and register so you can automatically receive the recording.
This is a complimentary online workshop for all of our clients. We hope you can join!
It’s Tax Time

 You probably don’t need a reminder that this is tax season.

Not only because tax returns are due in two weeks but also because you will soon receive your property tax notification in the mail.
Every two years your County re-assesses the value of your property and then sends that new value to you.
When this happens, many of our clients:
- Don’t agree with the new assessed value
- Aren’t sure what to do
- Are confused by the process
- Want to save money on property taxes
Good news! We have a webinar that will help you. On the webinar we will show you:
- How to read the information from the County
- What it means for you
- How to protest the valuation if you want
- How to get an accurate estimate of your property’s value
You can listen to the webinar live or get the recording. In any case, you can sign up at www.WindermereWorkshop.com
The webinar is April 17th at 10:00. If you can’t join live, go ahead and register so you can automatically receive the recording.
This is a complimentary online workshop for all of our clients. We hope you can join!
Party Like It’s 2018!

Just a few months ago most people thought mortgage rates were heading to 5% and now they are back to where they were a year ago.
You probably saw this week’s news from the Federal Reserve declaring that they would not raise their Federal Funds rate for the rest of 2019
(just three months after saying they would raise rates at least twice this year).
While this is big news, even bigger news for mortgage rates is that the 10-year Treasury yield just hit its lowest point since January 2018. One thing we’ve learned from our Chief Economist Matthew Gardner is that mortgage rates follow the 10-year treasury (not necessarily the Fed Funds rate).
Last Spring it looked like mortgage rates had bottomed out and they steadily climbed through the Summer and Fall of 2018. It looked certain that they would hit 5% around January.
Instead they started dropping. Now with the 10-year Treasury at a 15-month low, they just dropped a little more and they are back to where they were a year ago.
Great news for buyers! Party like it’s 2018!

Condo Cyclone


While the “Bomb Cyclone” closed roads and schools over the last two days, the “Condo Cyclone” is opening new opportunities for first-time buyers.
What’s the “Condo Cyclone” you ask. It’s the proliferation of multi-family inventory that has come on the market up and down the Front Range.
Compared to last year, multi-family inventory which includes town-homes and condominiums, has increased…
• 79% in Metro Denver
• 34% in Larimer County
• 45% in Weld County
This is terrific news for the market overall, as inventory has been unusually low for several months. It’s especially terrific news for first-time buyers who need this type of product as a stepping stone to home ownership.
What we notice is a $170,000 to $130,000 difference in average price between a single-family home and a multi-family home in Front Range markets.
Specifically, here’s the spread between multi-family and single-family average price:
• $349,801 vs. $512,312 in Metro Denver
• $312,493 vs. $469,294 in Larimer County
• $237,645 vs. $370,027 in Weld County
So as we dig out from the “Bomb Cyclone” we can be happy for the “Condo Cyclone” which brings more affordability and opportunity to our markets!
______________________________________________________________________
Just Released (a new resource site just for you…)
• Want to see the latest market trends?
• Curious to see the process of buying or selling a home?
• Interested in what it takes to own investment property?
• Be sure to visit www.ColoradoLivingBlog.com
The Office

 As you travel around the Front Range you will notice the following under construction:
- New Homes
- New Apartments
- New Medical Facilities
However, you will not notice new office buildings under construction.
What gives? I thought we had a booming economy. Why no new office buildings?
There are a couple of reasons. First, construction costs have sky rocketed. In ten years, construction costs have gone from about $200 per square foot to over $300 per square foot.
Rental rates have not increased at the same pace as construction costs so speculative investors can’t make their numbers work.
It’s too expensive to build compared to the rents that can be charged.
One reason why rental rates haven’t increased at high rate is property taxes. Property taxes on Class A office buildings have basically doubled in the last 10 years in many cases.
So, until rental rates catch up with construction costs, we won’t see many new office buildings under construction.
Vegas Baby!


The results are in from FHFA.gov’s latest ranking of the top performing markets in the U.S.
Each quarter they track 245 cities across the country and rank their real estate markets by home price appreciation.
What’s the highest performing city the the U.S.
Vegas! Their prices have gone up 17.63% in the last year.
How about the worst?
Bloomington, Illinois sits in dead last where prices went down 3.58%
Here’s how Colorado cities are ranked:
• #10 Colo. Springs = 11.41%
• #16 Greeley = 10.68%
• #59 Fort Collins = 8.29%
• #64 Denver = 8.15%
• #97 Boulder = 6.85%
The Whole Story
Metro Denver has 2.1 months of inventory on the market. This means that, at the current pace of sales, it would take just over 2 months to sell every single-family home currently listed for sale.
But that’s not the whole story because inventory levels vary drastically depending upon the price of the home.
When we take a closer look at months of inventory broken down by price range this is what we see:
• Under $400,000 = 0.9 months
• $400,000 to $500,000 = 1.8 months
• $500,000 to $750,000 = 3.1 months
• $750,000 to $1,000,000 = 4.2 months
• Over $1,000,000 = 7.7 months
These numbers represent great news for move-up buyers because they can sell in a strong market and potentially move up to a market that is market that is not as strong.
Below is a short video with a recap of our annual Market Forecast presentation!
How’s 2019?
A lot of our clients are asking how 2019 is starting off.
Here’s one thing we notice…
There are more homes to choose from, which is great news for buyers.
In January alone 4,821 homes came on the market in Metro Denver.
That is a 14% increase compared to one year ago.
At our annual Market Forecast, we predicted a more balanced market in 2019, so far it looks like we are trending that way.
________________________________________________________________________________________
Below is the recap of our Denver Annual Market Forecast!
Why No Bubble
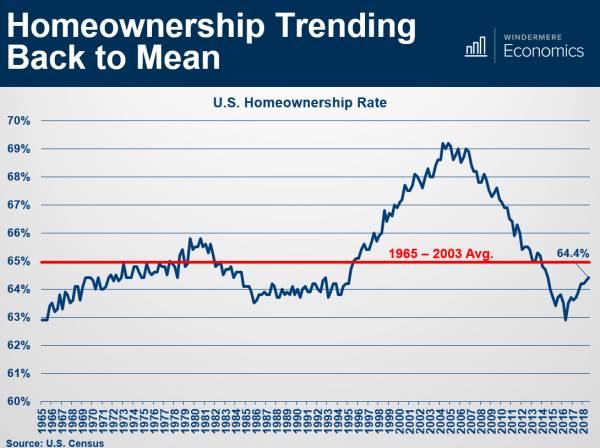
There are several reasons why our Chief Economist does not believe there is a housing bubble today in the U.S.
Below is a slide he shared at our recent market Forecast events.
It shows U.S. Home ownership rate, which is simply the percentage of the population who own their home (versus renting).
The long-term average is 65% represented by the red line.
In the graph you can clearly see the bubble forming. Starting in the mid-90’s, driven by several political and economic factors, more people than ever before became homeowners.

Then, starting in, 2008, the bubble burst and the percentage tumbled back down.
Now, as you can see, we are back at a “normal” level that resembles the long-term average.
________________________________________
If you would like a copy of the entire Forecast presentation, go ahead and reach out to us. We would be happy to put it in your hands.
