Economic Update with Matthew Gardner


Exclusive Invitation!!!
Tune in on Tuesday, October 6, 2020 at 9:00am to meet with Matthew Gardner, Windermere Real Estate’s Chief Economist LIVE and get your chance to ask him questions. He’ll be discussing the housing market, employment and the effects of COVID-19 on the local and national economy.
As one of the only real estate companies in the US that has a Chief Economist on staff, we have exclusive insights into the housing market, economy and government happenings. This is a one of a kind event for clients and friends of Windermere Real Estate in Colorado.
To sign up, please contact your Windermere Agent or message us to get the link. Seating is limited in digital meeting room so get your seat!
(If you can’t attend live, you can register to automatically get the recording.)
6 Million

The National real estate market just hit a massive milestone.
Based on the numbers through August, we are now on pace to sell 6 million homes. This is the highest pace we have seen in 14 years.
The 6 million threshold is a big deal in the real estate brokerage world.
Each month, as they have for a long time, the National Association of Realtors tracks the sales and then calculates the annualized rate of residential closings.
For many, many years this number has bounced around 5.5 million. The fact that it just jumped to 6 million speaks to many factors especially the effect of today’s interest rates.
Forbearance Falls

The number of loans in forbearance just fell to their lowest level since mid-April.
This is good news for the real estate market.
Less and less people are seeking payment relief on their mortgages.
The number of loans currently in forbearance stands at 7.16%.
This news coincides with the U.S. Unemployment Rate falling to it’s lowest level in 5 months as more people are getting their jobs back.
The economy has added back roughly half of the 22.2 million jobs that were lost in March and April of this year.
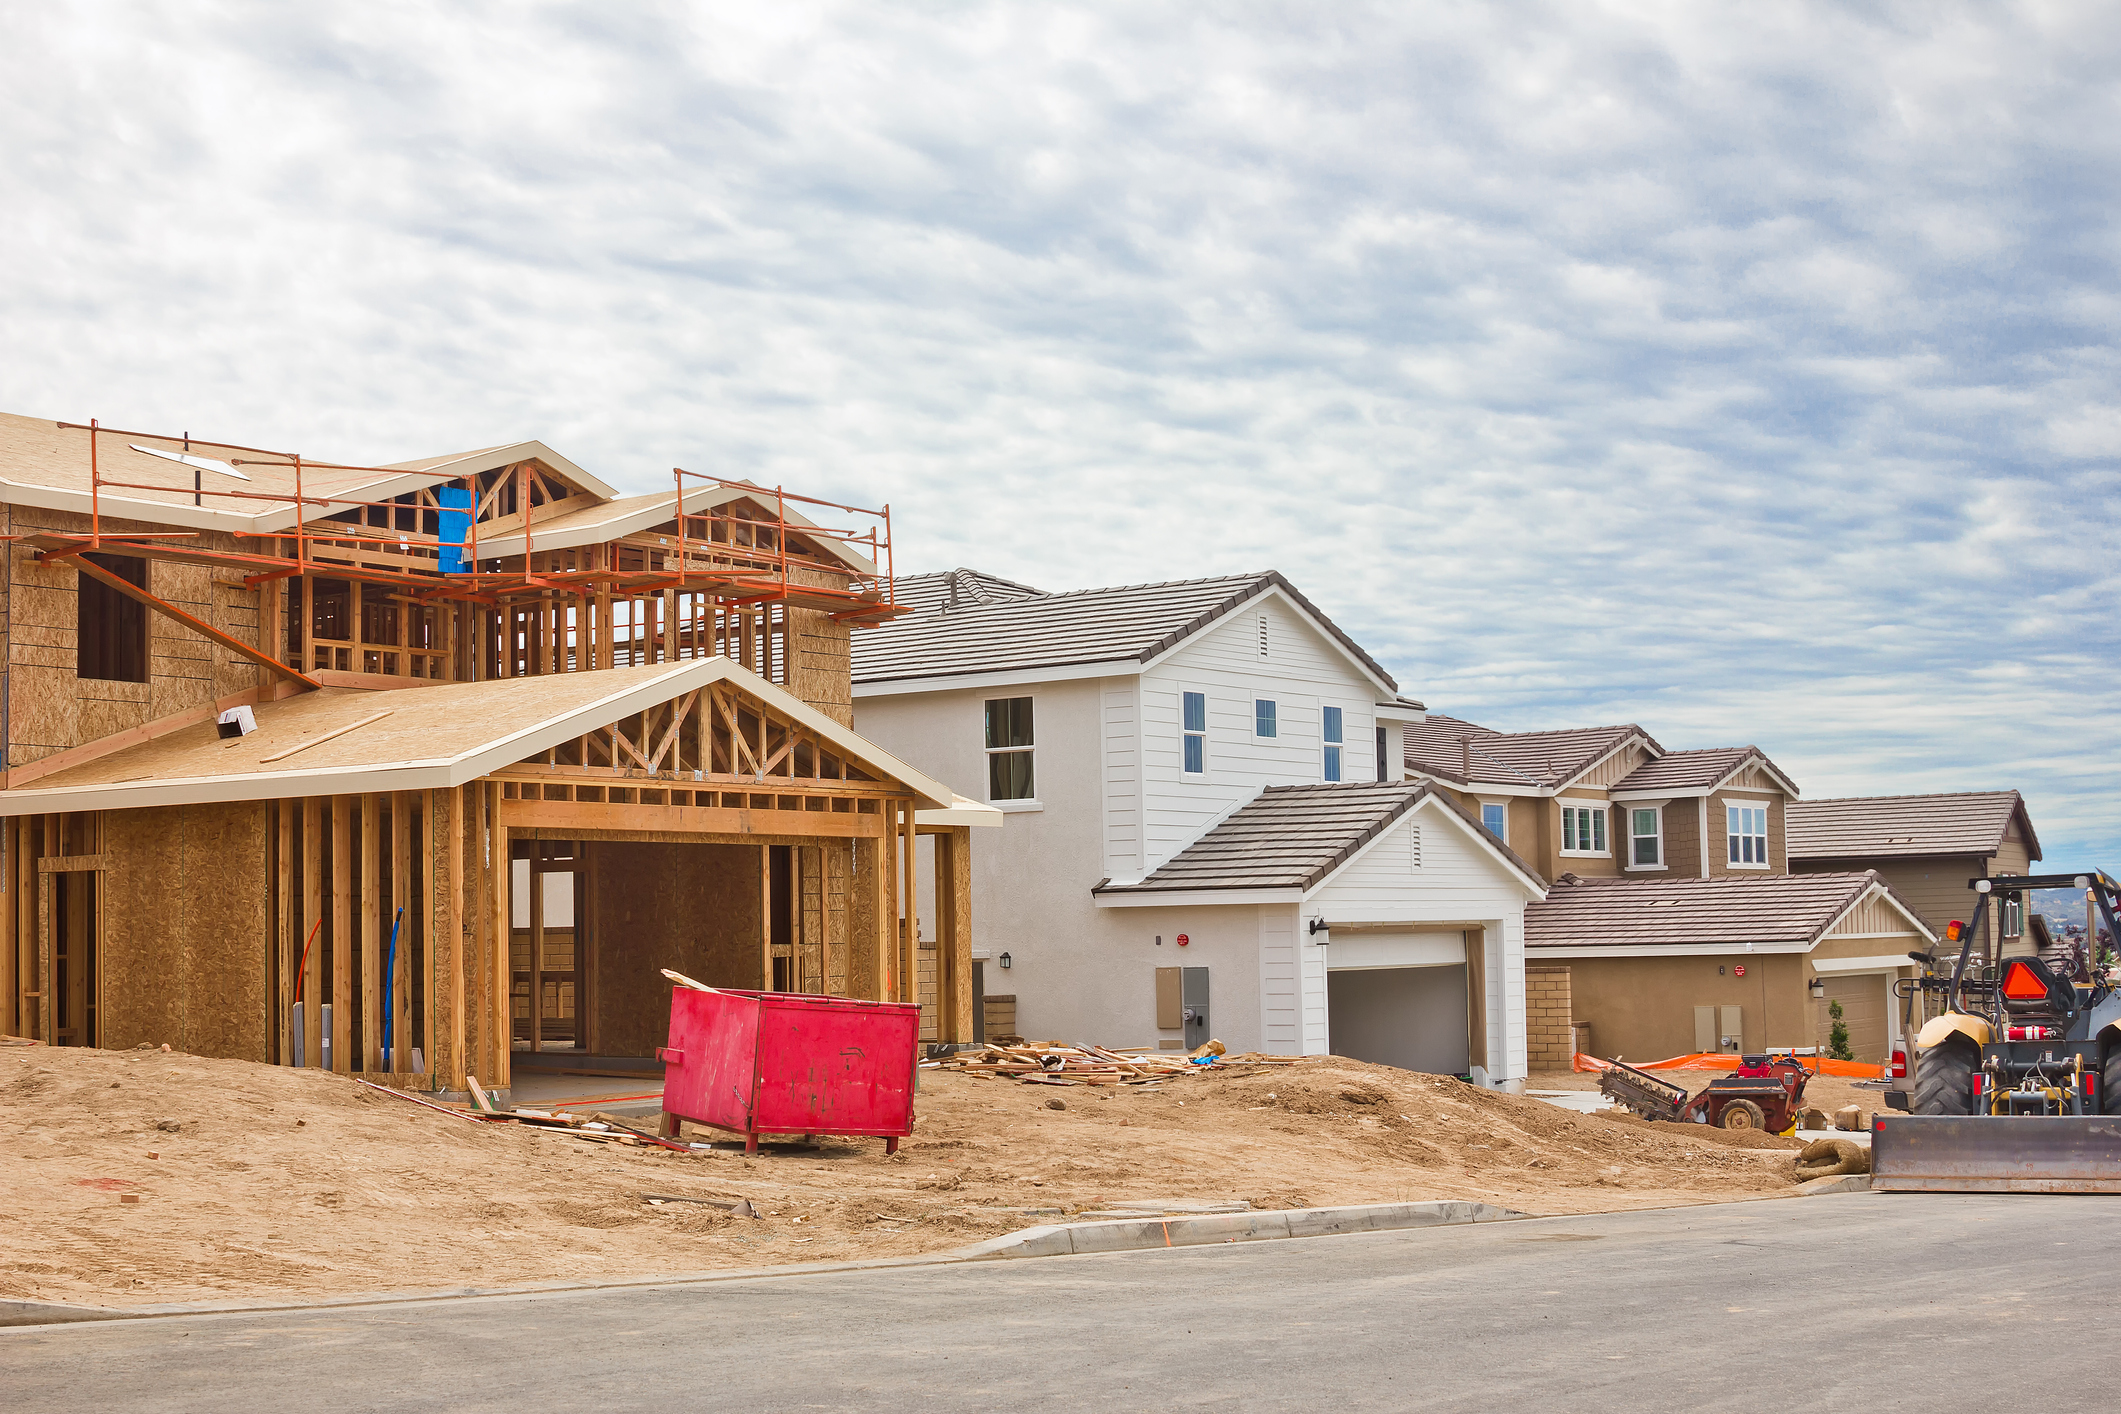
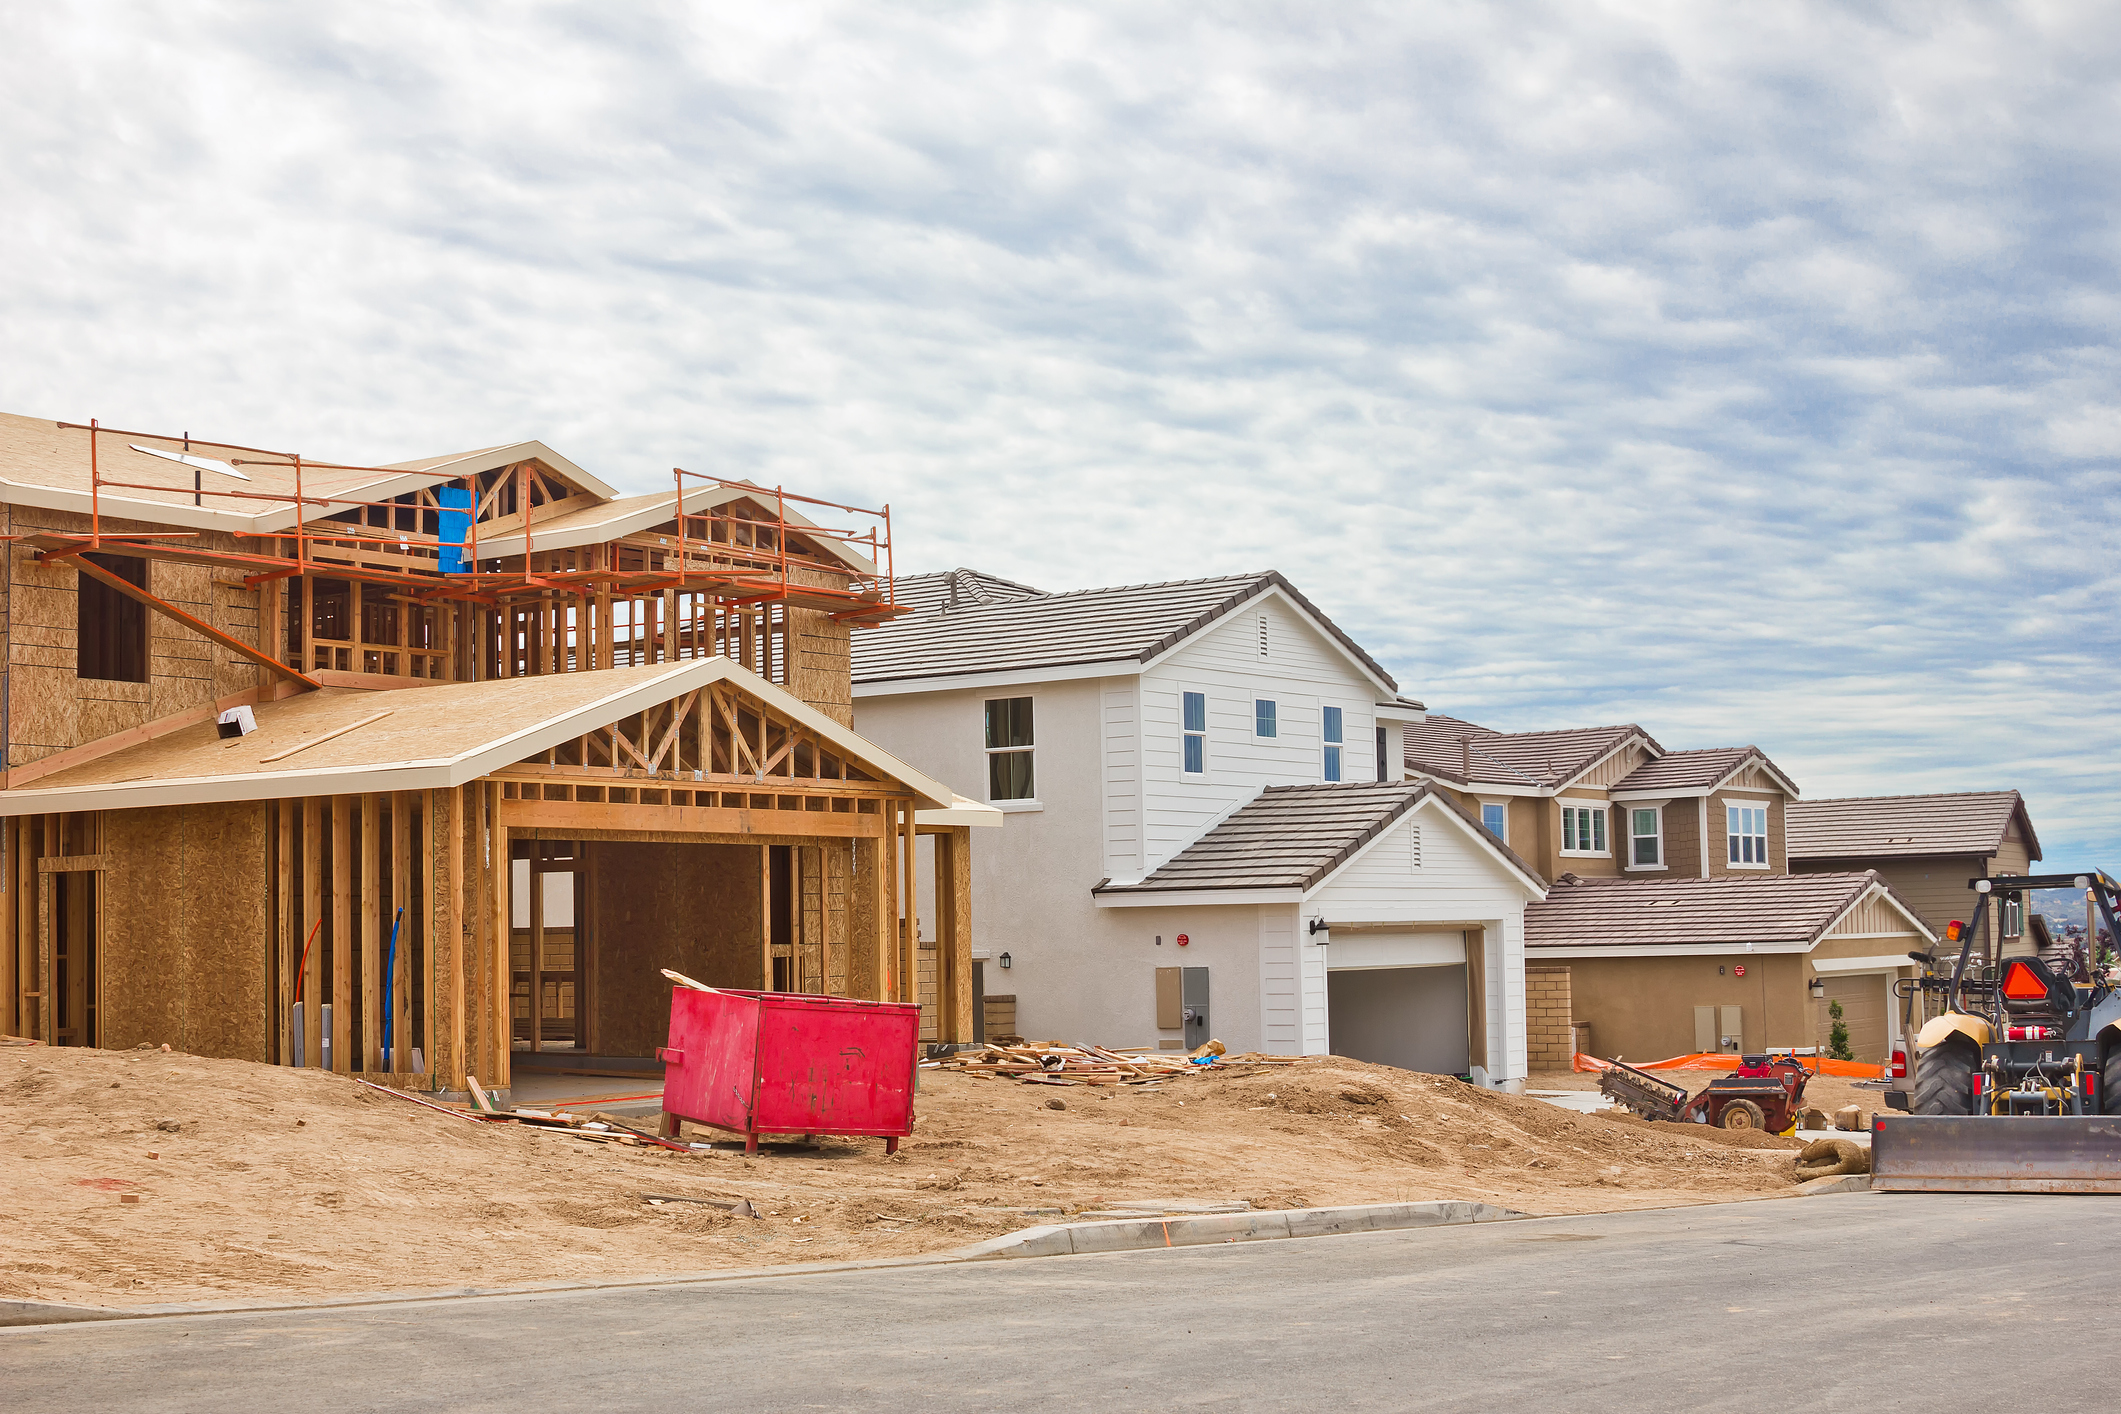
New Home Surge

Sales of new homes have jumped to their highest levels in 14 years.
The annualized rate of single-family new construction homes is now at 901,000 according to the new Census Bureau report.
This means that across the U.S., at the current pace of sales, there will be almost 1,000,000 new homes built and sold over the next 12 months.
This pace is 36% higher than one year ago and the highest it has been since the end of 2006.
Given the low inventory levels of previously-owned homes that most of the Country is experiencing, this uptick in new home activity is welcome news.
Price Report

The Federal Housing Finance Authority just released their most recent quarterly report which tracks home price appreciation in the top 100 metropolitan areas in the U.S. plus appreciation in individual states.
Some significant findings from the report:
House prices have risen for 36 consecutive quarters, or since September 2011.
House prices rose in all 50 states and the District of Columbia between the second quarters of 2019 and 2020.
The top five areas for annual appreciation were:
1) Idaho 10.8%
2) Arizona 9.1%
3) Washington 8.6%
4) Utah 8.1%
5) New Mexico 7.7%.
Idaho has been the leading state for the last 7 quarters.
Colorado showed annual appreciation of 4.4%.
The areas showing the lowest annual appreciation were:
1) West Virginia 1.1%
2) North Dakota 1.1%
3) District of Columbia 1.4%
4) Illinois 2.5%
5) Alaska 2.6%.
House prices rose in 99 of the top 100 largest metropolitan areas in the U.S. over the last four quarters.
Annual price increases were greatest in Honolulu, HI, where prices increased by 11.7%.
Prices were weakest in San Francisco, where they decreased by 0.3%.
Rebound

The Case-Shiller Home Price Index tracks appreciation in the 20 largest real estate markets across the U.S.
Their most recent quarterly report was just released this week.
Metro Denver prices are up over last year by 3.89% which is just slightly higher than the average of the 20 markets.
It is interesting to see how the 20 locations have performed since the pre-Great Recession housing peak.
Turns out that Denver has done the best out of all the markets.
Since 2008, Denver home prices have appreciated 64.9%. Second-best is Dallas at 55.5% and Seattle is third at 41.2%.
Believe it or not, there are markets where average home prices have still not returned to their 2008 levels.
Las Vegas is 14.5% below 2008 and Chicago is 12.8% below.
These numbers are another indicator of the long-term health and performance of the Front Range market.
Spring in Summer

This year the Spring market is occurring in the Summer.
Typically the busiest months for real estate along the Front Range are April, May and June.
This year, because showing activity was restricted in the Spring months, we are seeing robust activity this Summer.
Here’s an indicator. Sales through July 2020 versus July 2019 are up:
- 12.6% in Metro Denver
- 17% in Northern Colorado
To see double-digit increases in sales despite was is occurring in the National economy, is nothing short of remarkable.

Caught Up

We’ve been waiting for June to catch up. It finally happened (almost).
Back in April, real estate activity was significantly limited and the showing of property was restricted which caused the number of closed properties in May and early June to be much lower than last year.
Bottom line, fewer properties going under contract in April caused fewer closings 30 to 45 days later.
Closed properties in May were down compared to 2019 by 44% in Northern Colorado and 43% in Metro Denver.
Then activity jumped significantly in May. The number of properties going under contract was way up compared to last year.
We’ve been wondering when we would see this sales activity reflected in the number of closed properties.
Well, it finally happened (almost).
The number of closings so far in June compared to the same time period through June of 2019 is only down 1.8% in Northern Colorado and 1.6% in Metro Denver.
In both markets, there are only a handful of closings separating activity in June 2020 versus June 2019.
By the end of the month, when all the transactions are tallied up, we expect that June of this year will out pace June of last year in terms of number of transactions.
This is significant not only because of COVID-19, but also because of the reduced inventory compared to last year. Quite simply, there are fewer homes to buy.
All of this speaks to the health and resiliency of the Front Range market.

 Facebook
 X
X
 Pinterest
 Copy Link


