
 Facebook
 Twitter
 Pinterest
 Copy Link
Population Math

The brand new Census data has just been released and it is fascinating!
Colorado’s population now sits just below 6 million people at 5.773 million. Just 20 years ago it was 4.301 million.
Northern Colorado is booming and now has 688,047 in Larimer and Weld Counties. It grew by 135,592 people in just ten years. If Northern Colorado grows at just 2% per year, it will have 838,725 people by 2030 and 1,022,402 by 2040.
For several years we have been predicting that Northern Colorado would exceed by 1 million people by 2040 and it looks like that will come true.
Metro Denver is also booming. For reference, we define ‘Metro Denver’ as Adams, Arapahoe, Denver, Douglas, and Jefferson Counties.
Population in Metro Denver is now 2.831 million and was 2.109 million in the year 2000. It has grown by 722,000 people in 20 years.
If Metro Denver grows at 2% per year, it will hit 3.451 million in 10 years and 4.206 million in 20 years.
Local Nuances

“All markets are local” is a commonly used phrase in real estate.
This adage is proving to be true as we notice slight changes recently in the market.
Bottom line, the market, in some locations, is not behaving exactly like it did even 30 days ago. Properties that perhaps would have received 10 or more offers last month, are now receiving only one.
It is as important as ever to examine not only the general market area, but also hyper-local markets in order to understand the nuances that exist in specific locations.
A common activity we perform with our clients is to research the months of supply in their own neighborhood. We will frequently find that this stat varies considerably from the market as a whole.
To illustrate how ‘all markets are local,’ take a look at the days of inventory statistic for the following markets:
Larimer County = 18 days
Fort Collins = 15 days
80521 Zip Code = 24 days
80525 Zip Code = 9 days
While data on the overall market clarifies overall trends, it is the hyper-local research that is incredibly valuable when pricing property.
Misery Index

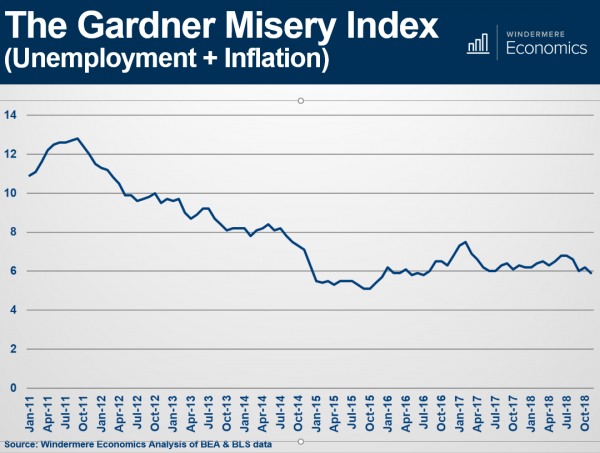
Last week at our Market Forecast events, Chief Economist Matthew Gardner shared, among many stats, his famous “Misery Index.”
A valuable statistic with a funny title.
The Misery Index simply measures inflation plus unemployment.
It’s an effective way to look at our Nation’s economy.
Today’s Index sits just below 6%. Back in October 2011, it was close to 13%.
The lowest it has been in the last 7 years is October 2015 when it was near 5%.
________________________________________
If you would like a copy of the entire Forecast presentation, go ahead and reach out to us.
We would be happy to put it in your hands.
