
 Facebook
 Twitter
 Pinterest
 Copy Link
Colorado Real Estate Market Update


The following analysis of the Metro Denver & Northern Colorado real estate market is provided by Windermere Real Estate Chief Economist Matthew Gardner. We hope that this information may assist you with making better-informed real estate decisions. For further information about the housing market in your area, please don’t hesitate to contact your Windermere agent.
ECONOMIC OVERVIEW
What a difference a quarter makes! Following the massive job losses Colorado experienced starting in February—the state shed over 342,000 positions between February and April—the turnaround has been palpable. Through August, Colorado has recovered 178,000 of the jobs lost due to COVID-19, adding 107,500 jobs over the past three months, an increase of 4.2%. All regions saw a significant number of jobs returning. The most prominent was in the Denver metropolitan service area (MSA), where 78,800 jobs returned in the quarter.
Although employment in all markets is recovering, there is still a way to go to get back to pre-pandemic employment levels. The recovery in jobs has naturally led the unemployment rate to drop: the state is now at a respectable 6.7%, down from a peak of 12.2%. Regionally, all areas continue to see their unemployment rates contract. I would note that the Fort Collins and Boulder MSA unemployment rates are now below 6%. Cases of COVID-19 continue to rise, which is troubling, but rising rates have only slowed—not stopped—the economic recovery. Moreover, it has had no noticeable impact on the state’s housing market.
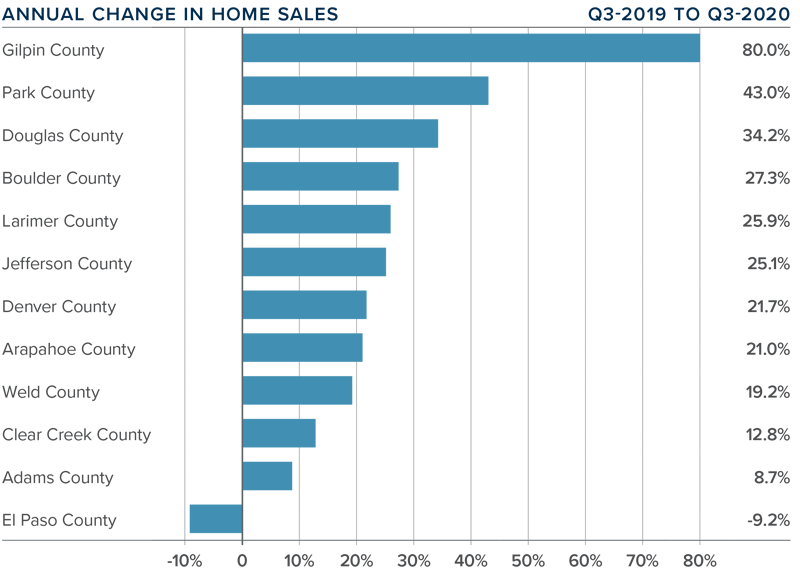
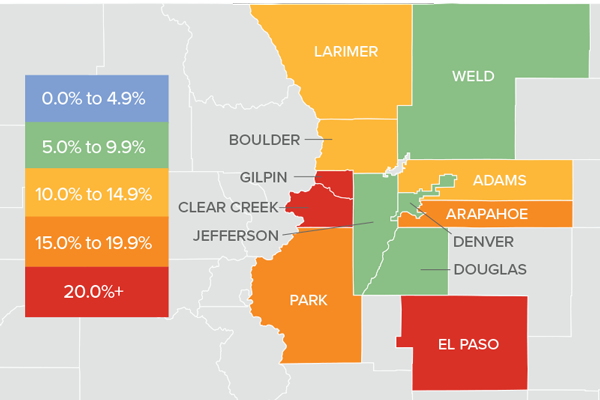
HOME SALES
- In the third quarter of 2020, 15,065 homes sold. This represents an increase of 20.4% over the third quarter of 2019, and a remarkable 52.7% increase over the second quarter of this year.
- Home sales rose in all markets other than El Paso compared to the second quarter of 2019. I believe sales are only limited by the number of homes on the market.
- Inventory levels remain remarkably low, with the average number of homes for sale down 44.5% from the same period in 2019. Listing activity was 17.8% lower than in the second quarter of 2020.
- Even given the relative lack of inventory, pending sales rose 17.8% from the second quarter, suggesting that closings for the final quarter of the year will be positive.
HOME PRICES
- After taking a pause in the second quarter, home prices rose significantly in the third quarter, with prices up 11.9% year-over
 -year to an average of $523,193. Prices were up 7.4% compared to the second quarter of this year.
 - Interest rates have been dropping. Although I do not see there being room for them to drop much further, they are unlikely to rise significantly. This is allowing prices to rise at above-average rates.
- Year-over-year, prices rose across all markets covered by this report. El Paso, Clear Creek, and Gilpin counties saw significant price appreciation. All but four counties saw double-digit price gains.
- Affordability in many Colorado markets remains a concern, as prices are rising at a faster pace than mortgage rates have been dropping.
 -year to an average of $523,193. Prices were up 7.4% compared to the second quarter of this year.
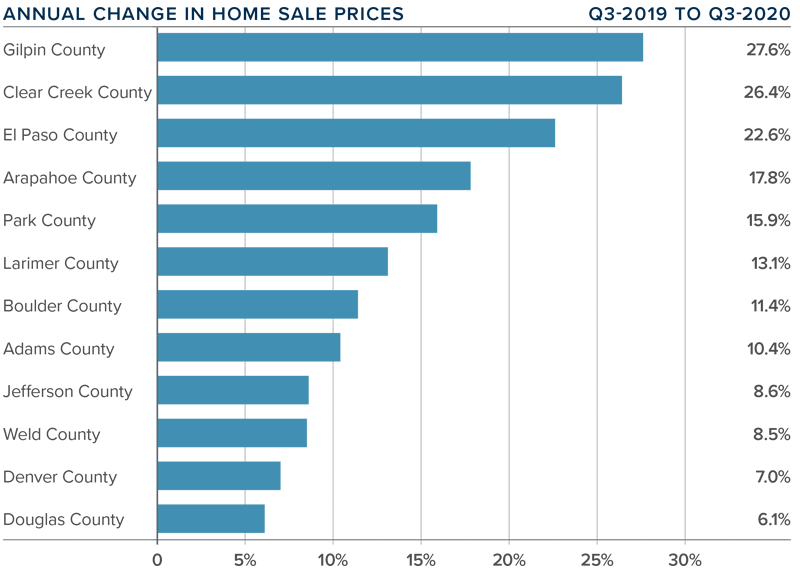
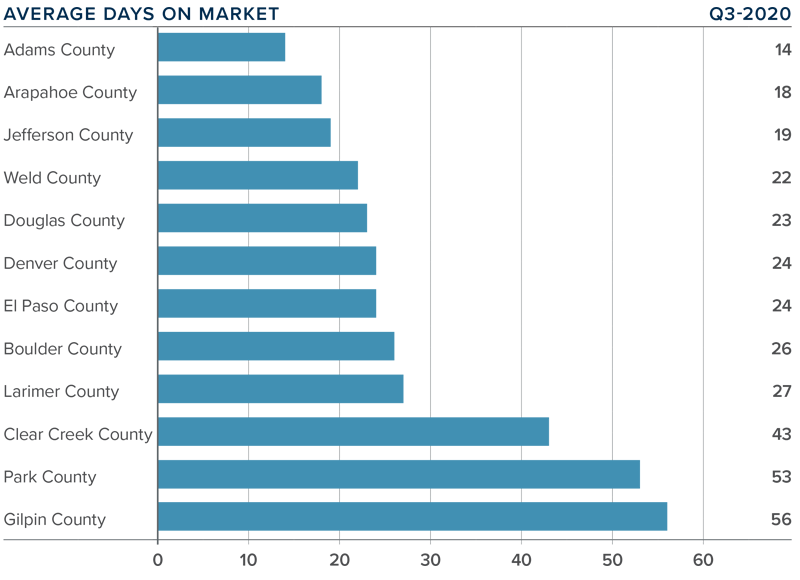
DAYS ON MARKET
- The average number of days it took to sell a home in the markets contained in this report dropped one day compared to the third quarter of 2019.
- The amount of time it took to sell a home dropped in nine counties, remained static in two, and rose in one compared to the third quarter of 2019.
- It took an average of 29 days to sell a home in the region.
- The Colorado housing market continues to demonstrate solid demand, and the short length of time it takes to sell a home suggests buyers are competing fiercely for available inventory.
CONCLUSIONS
 This speedometer reflects the state of the region’s real estate market using housing inventory, price gains, home sales, interest rates, and larger economic factors.
Demand for housing is significant, and sales activity is only limited by the lack of available homes to buy. Prices are rising on the back of very competitive mortgage rates and a job market in recovery. I suggested in my second-quarter report that the area would experience a “brisk summer housing market” and my forecast was accurate. As such, I have moved the needle a little more in favor of home sellers.
ABOUT MATTHEW GARDNER
 As Chief Economist for Windermere Real Estate, Matthew Gardner is responsible for analyzing and interpreting economic data and its impact on the real estate market on both a local and national level. Matthew has over 30 years of professional experience both in the U.S. and U.K.
In addition to his day-to-day responsibilities, Matthew sits on the Washington State Governors Council of Economic Advisors; chairs the Board of Trustees at the Washington Center for Real Estate Research at the University of Washington; and is an Advisory Board Member at the Runstad Center for Real Estate Studies at the University of Washington where he also lectures in real estate economics.
Stat of the Month


We just completed a review of the September numbers in our market.
Here is the one number that is standing out to us – average price.
Prices are way up over last year. Here are the specific average price increases in each of our markets compared to September 2019:
- Metro Denver = 13.2%
- Larimer County = 16.9%
- Weld County = 7.4%
This change in prices has of course generated questions from our clients.
To help our clients answer questions about prices and other real estate topics, we have set up a private online event with our Chief Economist Matthew Gardner.
The event is set for Tuesday from 9:00 to 10:00.
Simply reach out to any Windermere broker to receive your registration link.
Matthew will be addressing these questions as well as many others:
- What effect will the election have on the economy and on real estate?
- How long can interest rates stay this low?
- Can prices keep appreciating at their current pace?
This online event is for the clients and friends of Windermere. If you would like to register, please connect with your Windermere broker.
Economic Update with Matthew Gardner


Exclusive Invitation!!!
Tune in on Tuesday, October 6, 2020 at 9:00am to meet with Matthew Gardner, Windermere Real Estate’s Chief Economist LIVE and get your chance to ask him questions. He’ll be discussing the housing market, employment and the effects of COVID-19 on the local and national economy.
As one of the only real estate companies in the US that has a Chief Economist on staff, we have exclusive insights into the housing market, economy and government happenings. This is a one of a kind event for clients and friends of Windermere Real Estate in Colorado.
To sign up, please contact your Windermere Agent or message us to get the link. Seating is limited in digital meeting room so get your seat!
(If you can’t attend live, you can register to automatically get the recording.)
Rebound

The Case-Shiller Home Price Index tracks appreciation in the 20 largest real estate markets across the U.S.
Their most recent quarterly report was just released this week.
Metro Denver prices are up over last year by 3.89% which is just slightly higher than the average of the 20 markets.
It is interesting to see how the 20 locations have performed since the pre-Great Recession housing peak.
Turns out that Denver has done the best out of all the markets.
Since 2008, Denver home prices have appreciated 64.9%. Second-best is Dallas at 55.5% and Seattle is third at 41.2%.
Believe it or not, there are markets where average home prices have still not returned to their 2008 levels.
Las Vegas is 14.5% below 2008 and Chicago is 12.8% below.
These numbers are another indicator of the long-term health and performance of the Front Range market.

Matthew Gardner Weekly COVID-19 Housing & Economic Update: 5/11/2020

Job growth is critical to the health of the housing market, so on this week’s episode of “Mondays with Matthew,” Windermere Chief Economist Matthew Gardner analyzes the effect of COVID-19 on employment and what we can expect for the duration of the year.
What the Numbers Say

April represents the first time we can look at the impact of COVID-19 on a full month of real estate activity.
To no one’s surprise, activity in April in terms of closings and new contracts did slow significantly.
Much of this slowing was caused by in person showings not being allowed for most of the month.
(showings are now allowed again by following Safe Showings protocols)
Here’s what the numbers say…
Closed transactions were down compared to April 2019
- 26% in Northern Colorado (Larimer & Weld)
- 27% in Metro Denver
New written purchase agreements were down compared to April 2020
- 48% in Northern Colorado
- 44% in Metro Denver
So, while activity did slow, there was nothing resembling a “screeching halt” that took place.
While the way property is shown has certainly changed, the market is still very active and we expect activity to increase even more with showings now being allowed again.
Another Meltdown?

This week our Chief Economist took a deep dive into the numbers to examine the current health crisis versus the housing crisis of 2008.
The reason why? People wonder if we are going to have another housing meltdown nationally and going to see foreclosures and short sales dramatically increase.
It turns out that the numbers show that today’s housing environment is quite different than 2007, right before the housing bubble burst.
Specifically, homeowners are in a vastly different situation with their mortgage compared to the pre-Great Recession’s housing meltdown.
In addition to much higher credit scores and much higher amounts of equity compared to 2007, the most significant difference today is in the amount of ARM mortgages.
Back in years leading up to the housing bubble, Adjustable Rate Mortgages were very prevalent. In 2007 there were just under 13 million active adjustable rate loans, today there are just over 3 million.
The number of those ARMs that would reset within three years was 5 million in 2007 compared to only 320,000 today.
It’s those Adjustable Rate loans resetting to a higher monthly payment that caused such a big part of the housing crisis back in 2008 to 2010.
Back then not only was people’s employment impacted, but many were facing increased monthly mortgage payments.
That’s why there were so many foreclosures and short sales in 2008 to 2010.
That is not the case today and one of many reasons why we don’t foresee a housing meltdown.
Inventory Drop


An impact we expected from COVID-19 to the housing market is reduced inventory. That prediction is certainly proving to be true.
In March, the number of withdrawn properties from the MLS went up 68% in Larimer County and 38% in Weld when compared to March 2019.
Reduced inventory is one reason why we don’t expect a significant drop in home prices in 2020. We don’t see a glut of housing supply dragging prices down.
So how are properties being sold now? Virtually! We are helping people view homes using virtual 3D Tours and live online walk-throughs.
Our business right now is certainly not business as usual and our industry has proven to be resourceful so we can still help people with urgent real estate needs.
Economist’s Perspective

Our Chief Economist made a video for all of our clients where he shares his perspective on COVID-19’s impact on housing. You can watch it by clicking the image below:
 |
Where Are The Sales?


A high-level look at the Northern Colorado region shows that the number of residential sales is down 5.4% in Larimer County and up 4.7% in Weld County. This is simply comparing the number of closings from June 2018 to June 2019 versus June 2017 to June 2018.
The high-level look doesn’t tell the whole story. It get’s more interesting when we look at individual Northern Colorado cities and towns:
• Fort Collins = -8.8%
• Loveland = -5.7%
• Greeley = +11.7%
• Windsor = +16%
• Wellington = -16.9%
• Timnath = +44.1%
• Severance = +20.4%
• Johnstown = -18.7%
• Berthoud = +18.1%
• Evans = -14.7%
So, what can we learn from this? The areas with increased sales are where there is an abundance of new construction (Timnath and Severance for example).
The areas with decreased sales don’t have an abundance of new construction (Fort Collins for example).
The exceptions to this would be Wellington and Johnstown. It appears that there is price sensitivity to the new construction product now being built in these areas. Given rising costs, builders are challenged to deliver a product under $350,000 in these places.
For instance, in Wellington, between June 2017 and June 2018 there were 137 sales of new homes priced under $350,000. Today there are only 6 new homes on the market at that price point.
