
 Facebook
 X
X
 Pinterest
 Copy Link
Friday Fun Facts – Colorado’s Single-Family Housing Shortage: A Positive Path Forward

Colorado’s growing need for single-family homes is a challenge, but it also represents an opportunity to build stronger, more resilient communities. With its stunning landscapes and thriving economy, the state is well-positioned to embrace innovative solutions to meet the demand for housing.
The factors contributing to this shortage are clear:
- population growth
- rising costs
- zoning limitations
However, these challenges also pave the way for creative problem-solving and collaboration. By rethinking how housing is built and expanding opportunities for diverse development, Colorado can set an example for other states facing similar issues.
The benefits of addressing this housing shortage are far-reaching. Families will have greater access to homeownership, essential workers can live closer to their jobs, and communities can maintain their vibrancy. Rising to meet these needs isn’t just about building homes—it’s about creating lasting opportunities for current and future residents.
Communities across the state are already exploring solutions. Adjusting zoning regulations to allow for more housing types, encouraging affordable construction, and investing in infrastructure to support growth are just a few of the promising approaches. With input from policymakers, developers, and residents, Colorado can craft a balanced and sustainable path forward.
The housing shortage may be a challenge, but it’s also a chance to innovate and thrive. Together, Coloradans can create a future where housing is accessible, communities are strong, and opportunities are abundant for everyone who calls this beautiful state home.
Months of Supply

As measured by months of supply, we have a strong Seller’s market in Northern Colorado.
Both Larimer County and Weld County measure at 1.6 months of supply.
That means, at the current pace of sales, it would take only about 6 weeks to sell all of the existing homes for sale.
The measurement becomes even more interesting when we look at specific price ranges.
Under $500,000 is 1.0 months in Larimer and 0.9 in Weld.
$500,000 to $700,000 is 1.6 months in Larimer and 2.0 in Weld.
$700,000 to $1,000,000 is 2.0 months in Larimer and 3.0 in Weld.
And, over $1,000,000 is 3.6 months in Larimer and 5.3 in Weld.
We are not surprised to see higher months of inventory in higher price ranges.
It is interesting that even $1,000,000 properties have less than 6 months.
Half A Month

There is half of a month of inventory on the market. In other words, at the current pace of sales, it would take just two weeks to sell all of the homes currently listed for sale along the Front Range.
By definition, a market is balanced when there is 4 to 6 months of inventory. Anything less than that is a seller’s market.
The current inventory levels give us confidence about the future of price growth along the Front Range.
While we expect the pace of price appreciation to slow, the low supply of properties insulates us against any sort of price decline.
Q4 2021 Colorado Real Estate Market Update

The following analysis of the Metro Denver & Northern Colorado real estate market is provided by Windermere Real Estate Chief Economist Matthew Gardner. We hope that this information may assist you with making better-informed real estate decisions. For further information about the housing market in your area, please don’t hesitate to contact your Windermere Real Estate agent.
Regional Economic Overview
Following a decent summer when Colorado added around 14,000 jobs each month, the pace of recovery has slowed. That said, the latest data shows that more than 320,000 of the 376,000 jobs shed due to the pandemic have now returned. The state still needs to add a little more than 54,000 jobs in order to get back to pre-pandemic employment levels. Even though there has been a slowdown in the job recovery, which is likely due to the rise of new COVID-19 variants, I am still forecasting the state will return to its prior employment peak by the end of the summer. As jobs return, the employment rate continues to drop; it was 5.1% in November, well below the pandemic peak of 12.1%. Although it would be nice to see a lower rate, more people have returned to the workforce and are actively looking for work, which can stall job growth rates. From a regional perspective, unemployment levels range from a low of 3.8% in Boulder, to a high of 5.2% in Grand Junction.
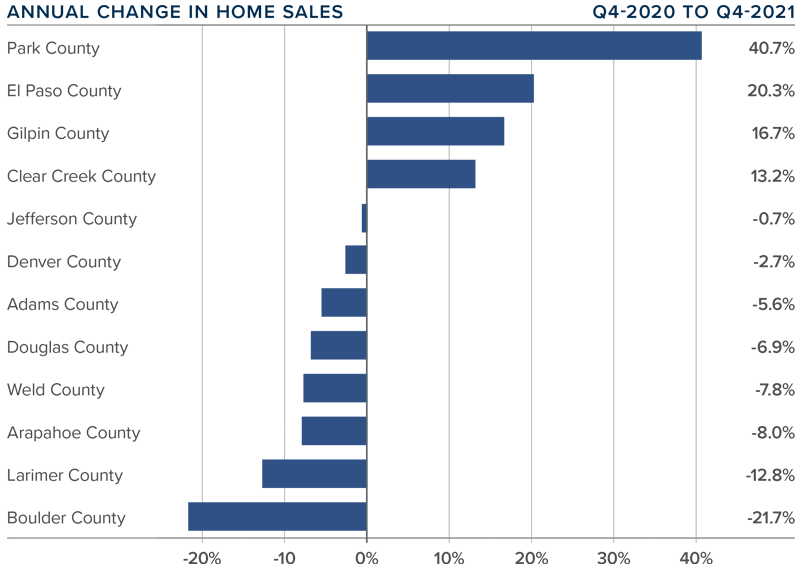
Colorado Home Sales
❱ In the final quarter of the year, 11,714 homes sold, representing a drop of 5.3% compared to the fourth quarter of 2020 and a drop of 17.6% compared to the third quarter of the year.
❱ While sales slowed region-wide, 4 of the 12 counties included in this report actually experienced significant sales increases.
❱ I’m not concerned that sales slowed compared to third quarter, as seasonal factors were likely the cause. It’s also likely that the year-over-year decline was due to the fact that there were 30% fewer homes for sale in the fourth quarter of 2021 than there were the previous year.
❱ Pending sales, which are an indicator of future closings, fell 29% compared to the third quarter, suggesting that closings in the first quarter of 2022 may also be light.
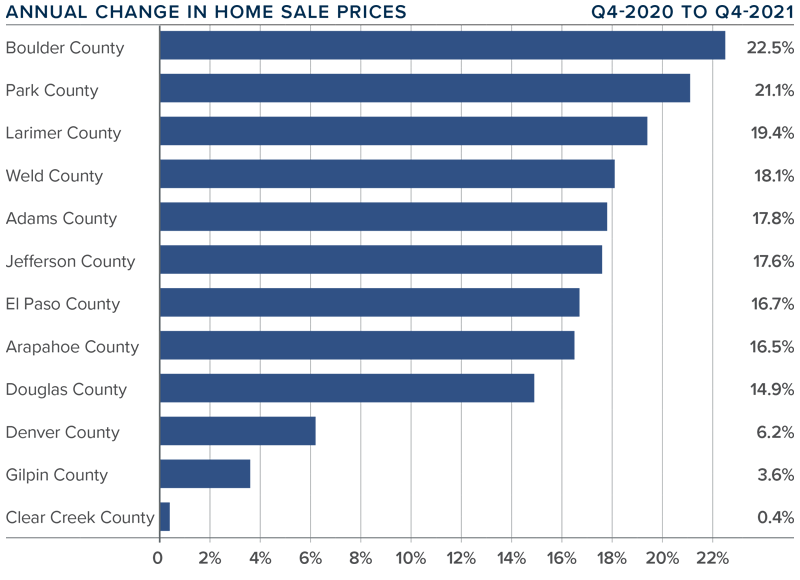
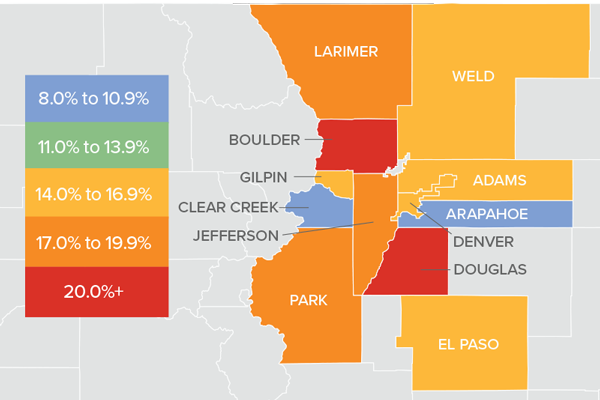
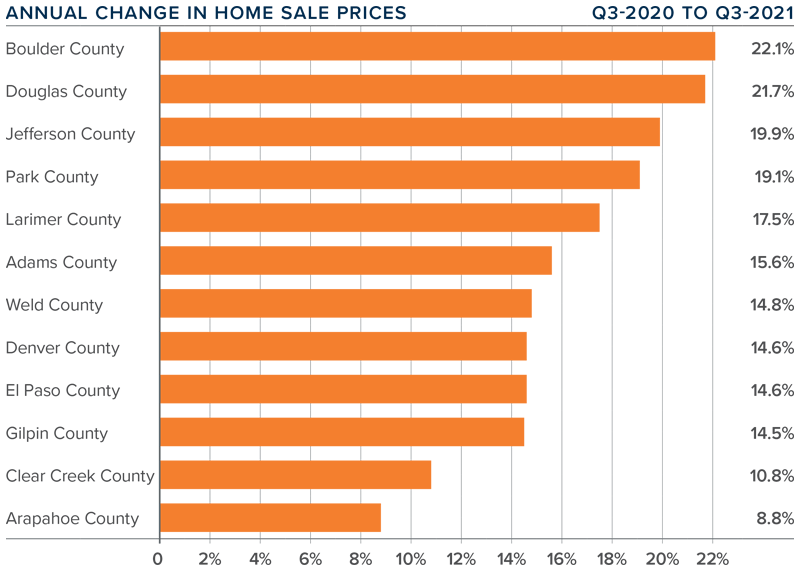
Colorado Home Prices

❱ The pace of home-price growth continued to slow, albeit modestly. The average sale price rose 14.8% year over year, to an average of $610,275. Prices also rose .8% from the previous quarter.
❱ Boulder County’s price growth was noteworthy, but of even greater interest was that average sale prices are holding above the $1 million ceiling.
❱ Year-over-year, prices rose across all markets covered by this report, with double-digit gains in all but three counties.
❱ The number of homes for sale remains woefully low in most areas, which continues to put upward pressure on home prices. That said, the pace of appreciation slowed through most of 2021. This trend is likely to continue in 2022.
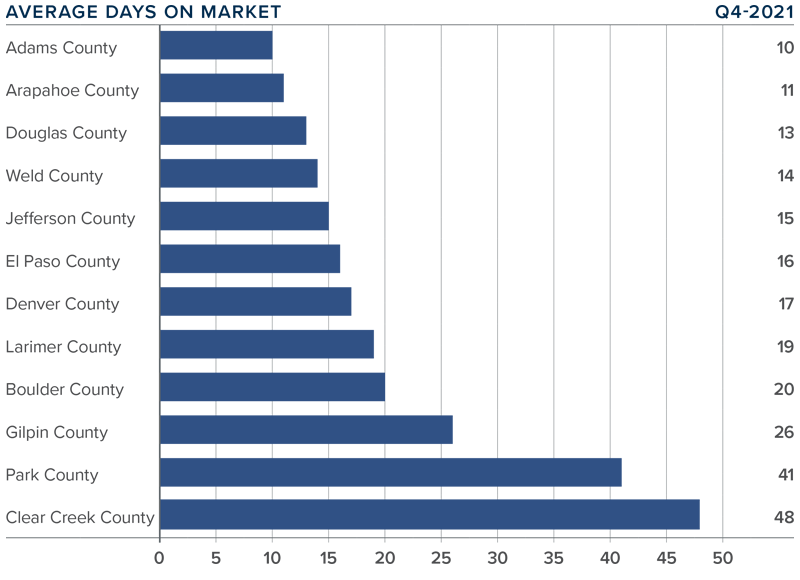
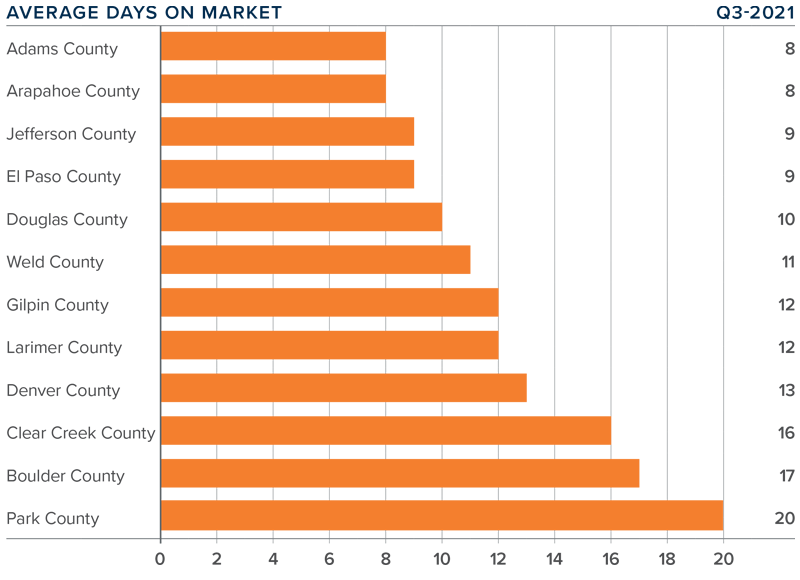
Days on Market
❱ The average number of days it took to sell a home in the markets contained in this report fell five days compared to the final quarter of 2020.
❱ The length of time it took to sell a home dropped in every county other than Clear Creek County compared to the same quarter a year ago.
❱ It took an average of only 21 days to sell a home in the region. Although the pace dropped year over year, it rose 9 days compared to the previous quarter.
❱ Ongoing supply limitations and strong demand have caused the pace of sales to remain brisk. That said, the length of time it took to sell a home rose compared to the third quarter. I don’t think this is a major concern and can likely be attributed to seasonal factors.
Conclusions

This speedometer reflects the state of the region’s real estate market using housing inventory, price gains, home sales, interest rates, and larger economic factors.
Inventory is still lacking, which is causing prices to rise at well-above-average rates. That said, despite how few homes are for sale, the pace of appreciation has been slowing and will likely continue to do so as mortgage rates climb.
My current forecast is for 30-year rates to stairstep higher as we move through the year, which will act as a headwind to price growth. Although I do not see rates getting above 4% until 2023, the increase in borrowing costs will start to have a greater impact on home prices.
In addition to rising mortgage rates, the significant growth in prices over the past year has started to impact housing affordability. Although the market will continue to perform well, rising financing costs and lower affordability may slowly move the market back toward some sort of balance.
All things considered, I am moving the needle a little toward buyers, but it still heavily favors home sellers.
About Matthew Gardner

As Chief Economist for Windermere Real Estate, Matthew Gardner is responsible for analyzing and interpreting economic data and its impact on the real estate market on both a local and national level. Matthew has over 30 years of professional experience both in the U.S. and U.K.
In addition to his day-to-day responsibilities, Matthew sits on the Washington State Governors Council of Economic Advisors; chairs the Board of Trustees at the Washington Center for Real Estate Research at the University of Washington; and is an Advisory Board Member at the Runstad Center for Real Estate Studies at the University of Washington where he also lectures in real estate economics.
Q3 2021 Colorado Real Estate Market Update

The following analysis of the Metro Denver & Northern Colorado real estate market is provided by Windermere Real Estate Chief Economist Matthew Gardner. We hope that this information may assist you with making better-informed real estate decisions. For further information about the housing market in your area, please don’t hesitate to contact your Windermere Real Estate agent.
Regional Economic Overview
The rise in COVID-19 infections due to the Delta variant caused Colorado’s job recovery to slow, but not as much as in many other states. The latest data (for August) shows that more than 293,000 of the 376,000+ jobs that were shed due to COVID-19 have returned. This is good news, with only 83,000 jobs needed to return to pre-pandemic employment levels. The metro areas contained in this report have recovered 243,700 of the 310,000 jobs lost, and I expect the state will recover the remaining jobs by next summer. With employment levels improving, the state unemployment rate currently stands at 5.9%—down from the pandemic peak of 12.1%. Regionally, unemployment levels range from a low of 4.4% in Boulder to a high of 6.1% in Grand Junction.
__________
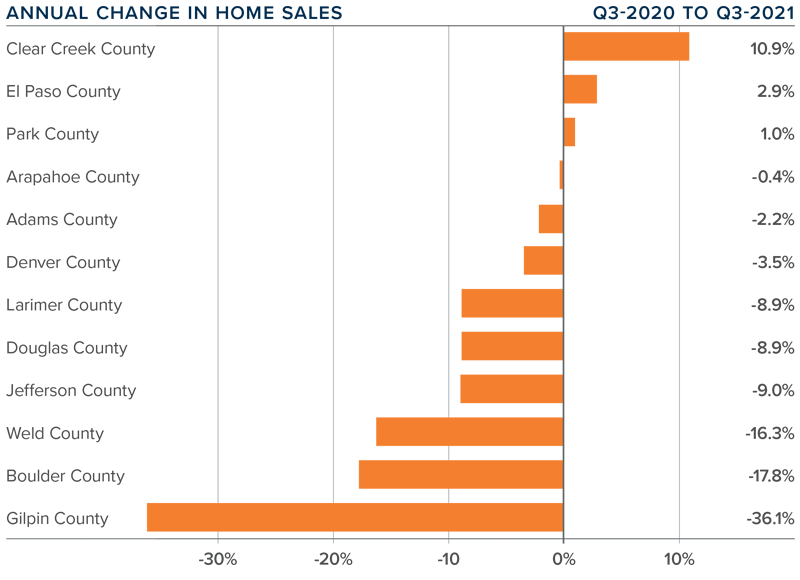
Colorado Home Sales
❱ Compared to a year ago, listing activity was down more than 30%. However, inventory levels were up 38.3% compared to the second quarter of this year, suggesting that buyers have more choice now than they have seen in some time.
❱ Although comparing current sales activity with that of a year ago is not that informative—given that the country was experiencing a massive rebound in housing demand following the outbreak of COVID-19—it was pleasing to see sales up in every county other than Denver and Douglas compared to the second quarter of this year.
❱ Pending sales (an indicator of future closings) were down 5.4% compared to the second quarter of the year, suggesting that closings in the final quarter may well be a little soft.
__________
Colorado Home Prices
❱ Prices continue to appreciate at a very rapid pace, with the average sale price up 15.8% year over year to an average of $605,576. Sale prices were 1.6% lower than in the second quarter of 2021.
❱ Four counties—Arapahoe, Douglas, Weld, and Park—saw the average home sale price pull back between the second quarter and the third, but I am not overly concerned by this at the present time.
❱ Year-over-year, prices rose across all markets covered by this report. All counties except Arapahoe saw double-digit gains, but even that market saw an increase in sale prices.
❱ Several counties are experiencing a drop in average list prices, which is a leading indicator of future activity. As such, I expect to see the rise of sale prices start to slow, which will be a welcome sight for many buyers.
__________
Days on Market
❱ The average number of days it took to sell a home in the markets contained in this report dropped 17 days compared to the third quarter of 2020.
❱ The length of time it took to sell a home dropped in every county contained in this report compared to both the same quarter a year ago and the second quarter of this year.
❱ It took an average of only 12 days to sell a home in the region, which is down 2 days compared to the second quarter of 2021.
❱ The Colorado housing market remains very tight as demonstrated by the fact that it took less than three weeks for homes to sell in all counties contained in this report.
Conclusions

This speedometer reflects the state of the region’s real estate market using housing inventory, price gains, home sales, interest rates, and larger economic factors.
The job market continues to improve, which is always a stimulant when it comes to home buying. Inventory levels have improved, and lower pending sales suggest that buyers are taking a little longer to decide on a home. That said, the market is still bullish as indicated by the short length of time it took to sell a home in the quarter. Mortgage rates will start to creep higher as we move into the winter months, and this may stimulate additional buying activity. In the last edition of The Gardner Report, I suggested we would see more homes come to market and that has proven to be accurate. Given these factors, I am moving the needle a little toward buyers, but it remains a staunchly seller’s market.
About Matthew Gardner
As Chief Economist for Windermere Real Estate, Matthew Gardner is responsible for analyzing and interpreting economic data and its impact on the real estate market on both a local and national level. Matthew has over 30 years of professional experience both in the U.S. and U.K.
In addition to his day-to-day responsibilities, Matthew sits on the Washington State Governors Council of Economic Advisors; chairs the Board of Trustees at the Washington Center for Real Estate Research at the University of Washington; and is an Advisory Board Member at the Runstad Center for Real Estate Studies at the University of Washington where he also lectures in real estate economics.
Inventory Uptick

We are noticing a trend that is very good news for buyers.
Inventory has been increasing over the last month which means that buyers now have more properties to consider.
Just in the last week, the number of homes for sale has increased:
13% in Larimer County
12% in Weld County
11% in Metro Denver
If you are a buyer who has been waiting for home properties to look at, now is the time!
Stat of the Month


We just completed a review of the September numbers in our market.
Here is the one number that is standing out to us – average price.
Prices are way up over last year. Here are the specific average price increases in each of our markets compared to September 2019:
- Metro Denver = 13.2%
- Larimer County = 16.9%
- Weld County = 7.4%
This change in prices has of course generated questions from our clients.
To help our clients answer questions about prices and other real estate topics, we have set up a private online event with our Chief Economist Matthew Gardner.
The event is set for Tuesday from 9:00 to 10:00.
Simply reach out to any Windermere broker to receive your registration link.
Matthew will be addressing these questions as well as many others:
- What effect will the election have on the economy and on real estate?
- How long can interest rates stay this low?
- Can prices keep appreciating at their current pace?
This online event is for the clients and friends of Windermere. If you would like to register, please connect with your Windermere broker.
Good Loan News


Here are two recently-announced pieces of really good news for home buyers.
• The Colorado Housing and Finance Authority recently raised the income limit for their down payment assistance program to $115,600.
Now more people can get help with a down payment.
• Fannie Mae and Freddie Mac raised their conforming loan limits so that more people can use a conforming loan and not be forced to use a ‘jumbo’ loan.
Contact us if you would like to hear how these pieces of news could help you.
